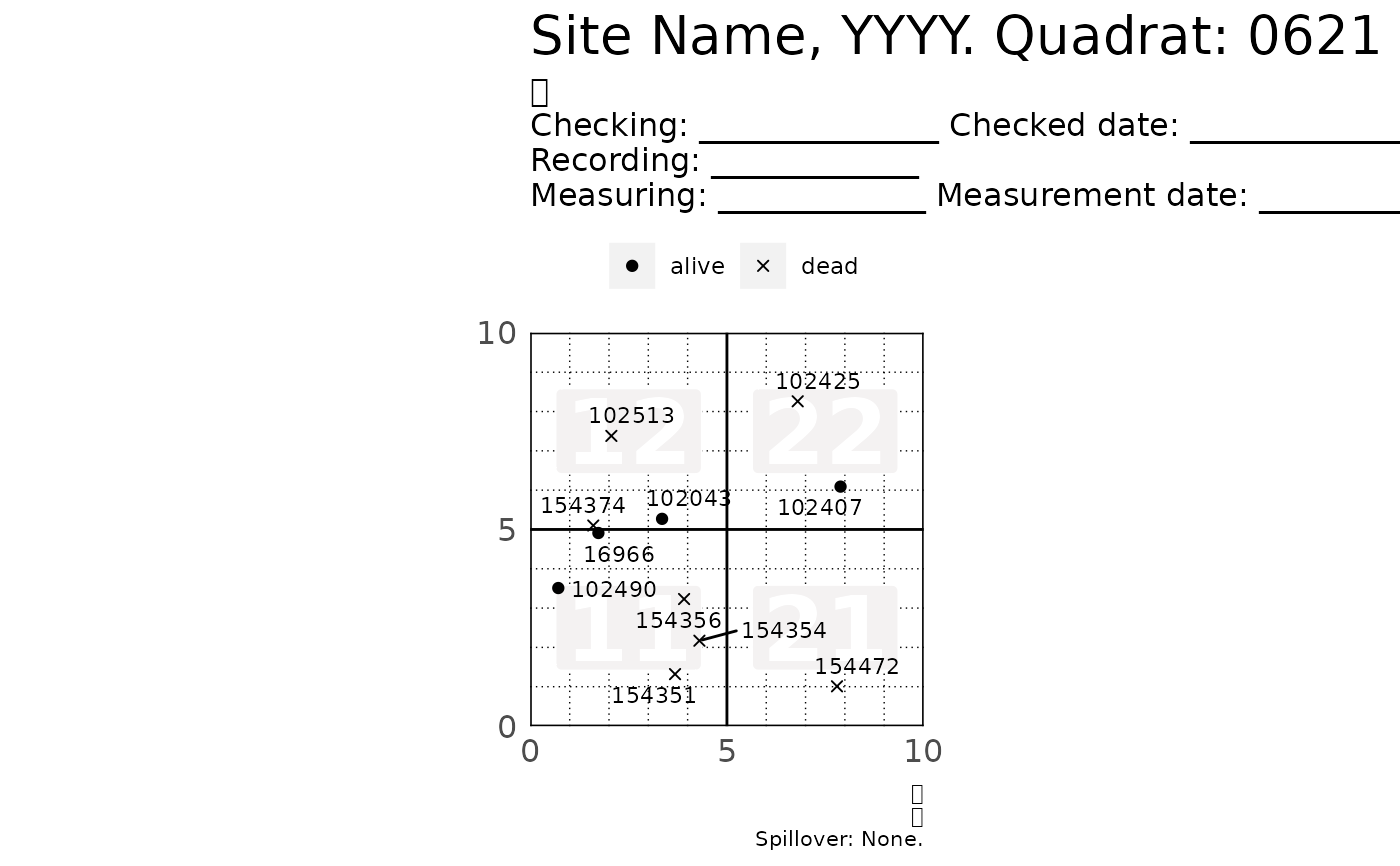
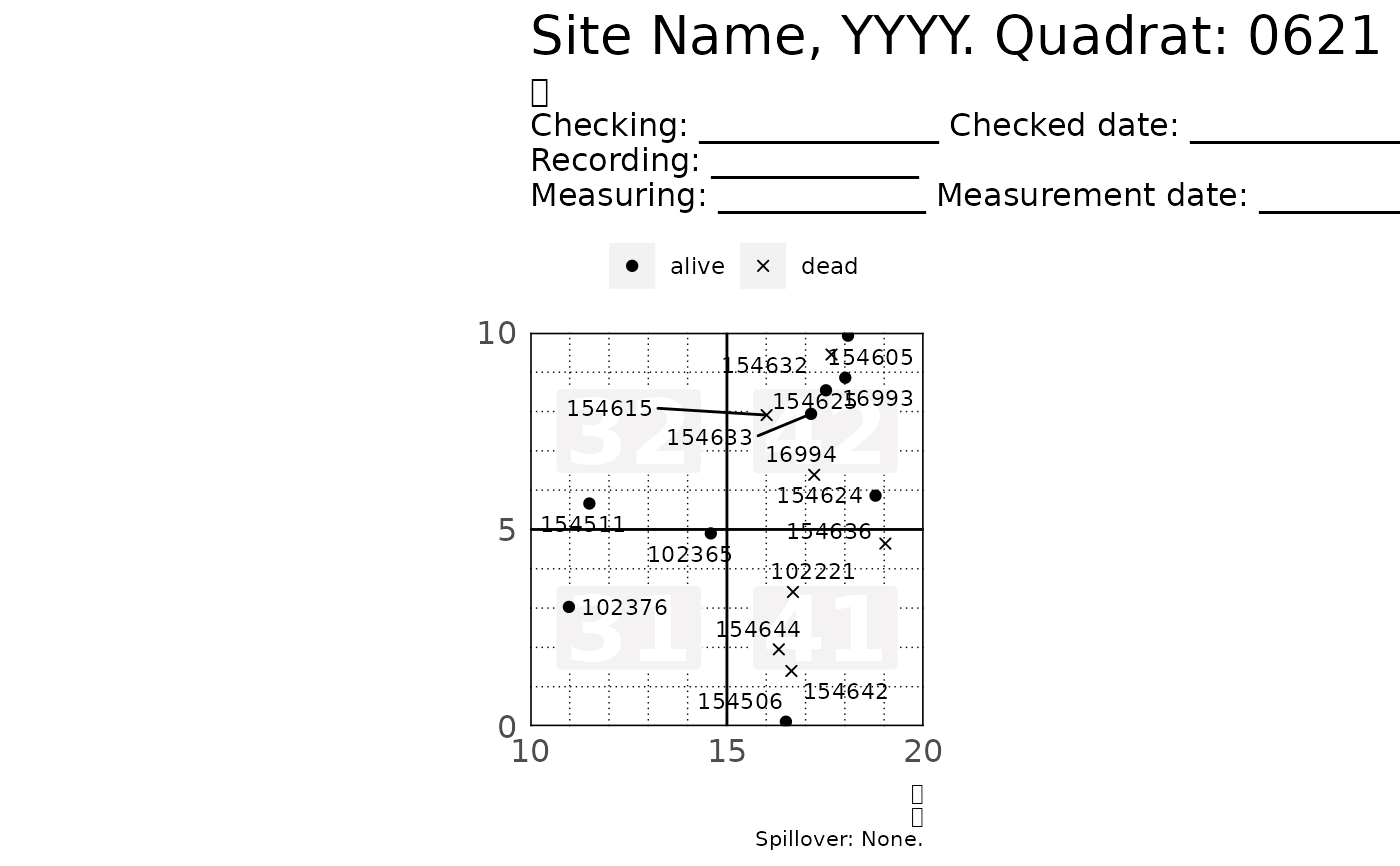
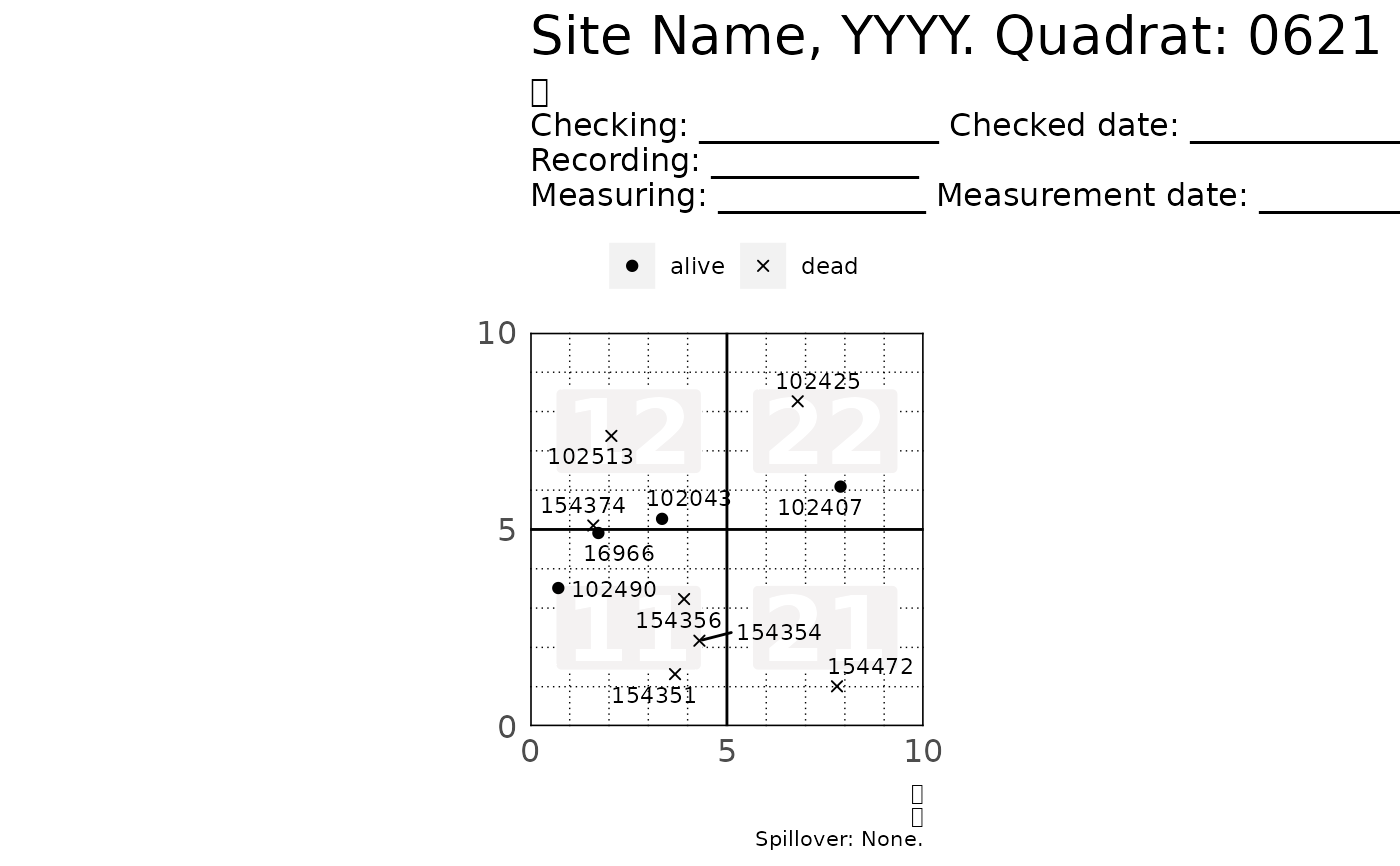
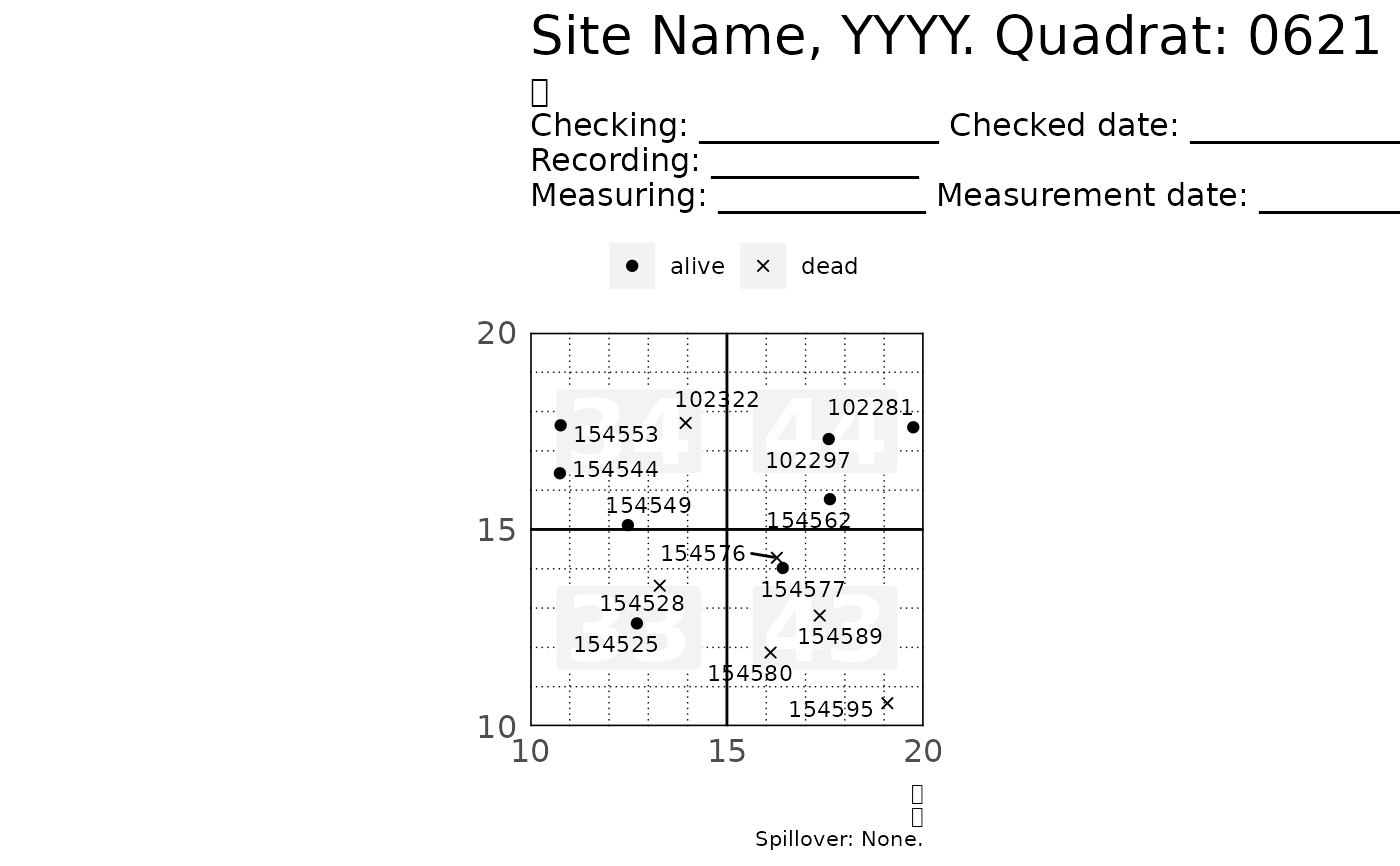
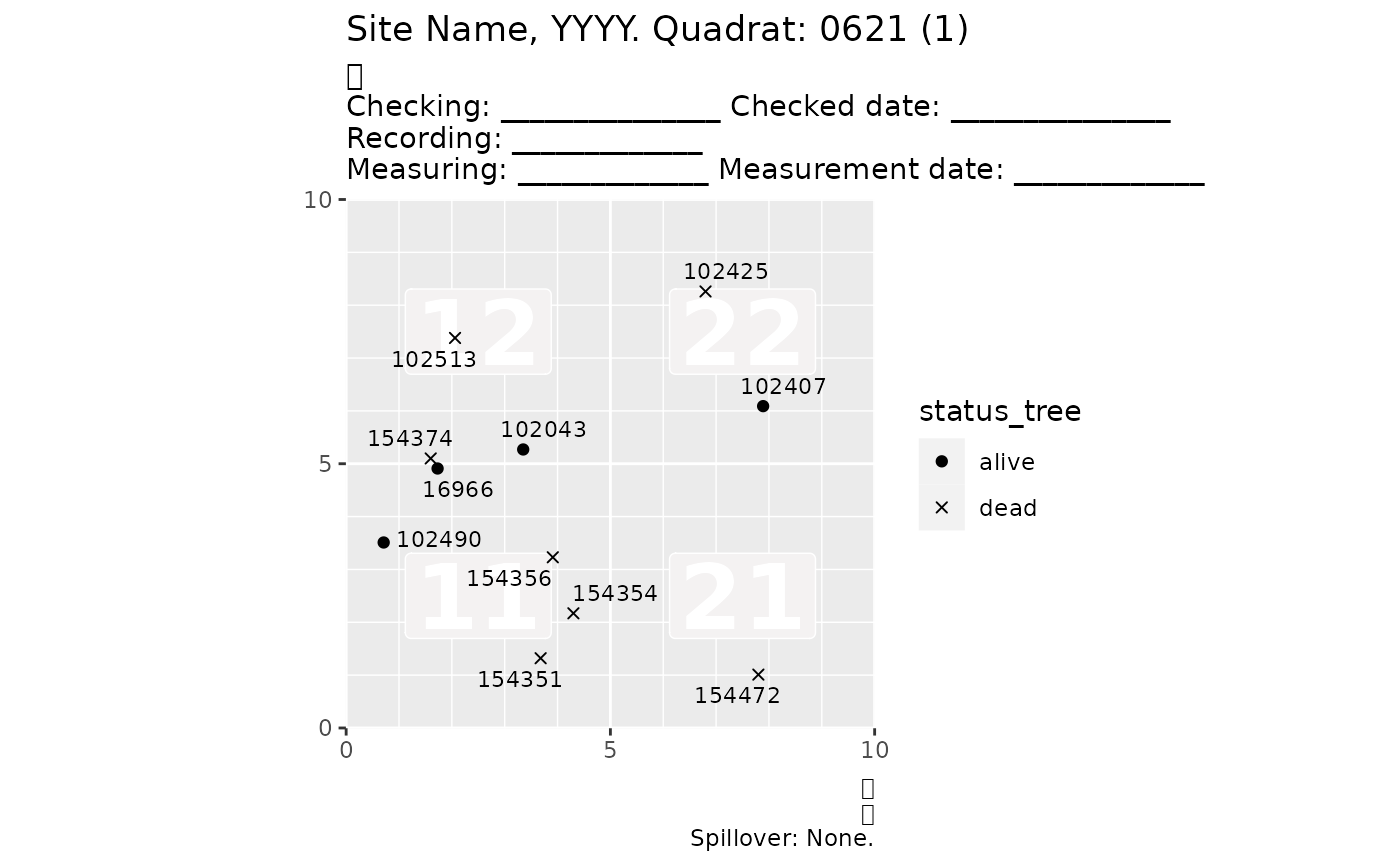
List plots of tree-tag status by subquadrat (good for .pdf output).
Source:R/plot_tag_status_by_subquadrat.R
plot_tag_status_by_subquadrat.RdThis function plots tree tags by status and outputs a list of plots that can
be printed on a .pdf file. Each plot shows four subquadrats within a quadrat.
The symbols on the plot represent the status of each tree -- not the status of
each stem. Although you should likely provide data of only one or two
censuses, plot_tag_status_by_subquadrat() will summarize the data to reduce
overplotting. The data on the plot summarizes the history of each stem across
all censuses provided. Each tag will appear in the plot only once or twice:
A tag will appear once if it belongs to a tree which status was unique across all censuses provided -- either "alive" or "dead".
A tag will appear twice if it belongs to a tree which status was "alive" in at least one census, and also "dead" in at least one other census. This feature avoids unintentional overplotting and makes interpreting the plot easier.
plot_tag_status_by_subquadrat(
  vft,
  x_q = 20,
  x_sq = 5,
  y_q = 20,
  y_sq = 5,
  subquad_offset = NULL,
  bl = 1,
  br = 2,
  tr = 3,
  tl = 4,
  title_quad = "Site Name, YYYY. Quadrat:",
  show_page = TRUE,
  show_subquad = TRUE,
  point_shape = c(19, 4),
  point_size = 1.5,
  tag_size = 3,
  header = header_tag_status(),
  theme = theme_tag_status(),
  move_edge = 0
)
Arguments
- vft
A ForestGEO ViewFullTable (dataframe).
- x_q, y_q
Size in meters of a quadrat's side. For ForestGEO sites, a common value is 20.
- x_sq, y_sq
Size in meters of a subquadrat's side. For ForestGEO-CTFS sites, a common value is 5.
- subquad_offset
NULLor-1.NULLdefines the first column of subquadrats as 1.-1defines the first column of subquadrats as 0.subquad_offset = NULL subquad_offset = -1 --------------------- ------------------- 14 24 34 44 04 14 24 34 13 23 33 43 03 13 23 33 12 22 32 42 02 12 22 32 11 21 31 41 01 11 21 31- bl, br, tr, tl
Number or character giving the label of the four subquadrats on each or the four divisions of a quadrat: bottom left (bl), bottom right (br), top right (tr), and top left (tl).
- title_quad
A string to use as a title.
- show_page
Logical;
FALSEremoves the page label from the plot title.- show_subquad
Logical;
FALSEremoves subquadrat labels on each plot.- point_shape
A vector of two numbers giving the shape of the points to plot (see possible shapes in the documentation of ?
graphics::points(), under the section entitled 'pch' values).- point_size
A number giving points size. Passed to
ggplot2::geom_point().- tag_size
A number giving tag size. Passed to ggrepel::geom_text_repel.
- header
A string to use as a header (see headers).
- theme
An object of class "theme".
- move_edge
A number to adjust the extension of the grid lines beyond the plot limits.
Value
A list of objects of class "ggplot".
Acknowledgment
Useful ideas and guidance came from Suzanne Lao, Stuart Davis, Shameema Jafferjee Esufali, David Kenfack and Anudeep Singh. Anudeep Sinh also wrote the algorithm to calculate subquadrats.
See also
graphics::points(), ggplot2::geom_point(), ggplot2::theme()
header_tag_status(), theme_tag_status(), fgeo.tool::add_subquad(),
ggrepel::geom_text_repel.
Other plot functions:
autoplot.fgeo_habitat(),
autoplot.sp_elev(),
autoplot_by_species.sp_elev(),
elev(),
plot_dbh_bubbles_by_quadrat(),
sp_elev(),
sp()
Other functions to list plots from ForestGEO ViewFullTable:
plot_dbh_bubbles_by_quadrat()
Other functions to plot tag status:
header_tag_status(),
theme_tag_status()
Examples
assert_is_installed("fgeo.x")
# Create a small VieFullTable
first <- function(x) x %in% sort(unique(x))[1]
small_vft <- subset(fgeo.x::vft_4quad, first(CensusID) & first(QuadratID))
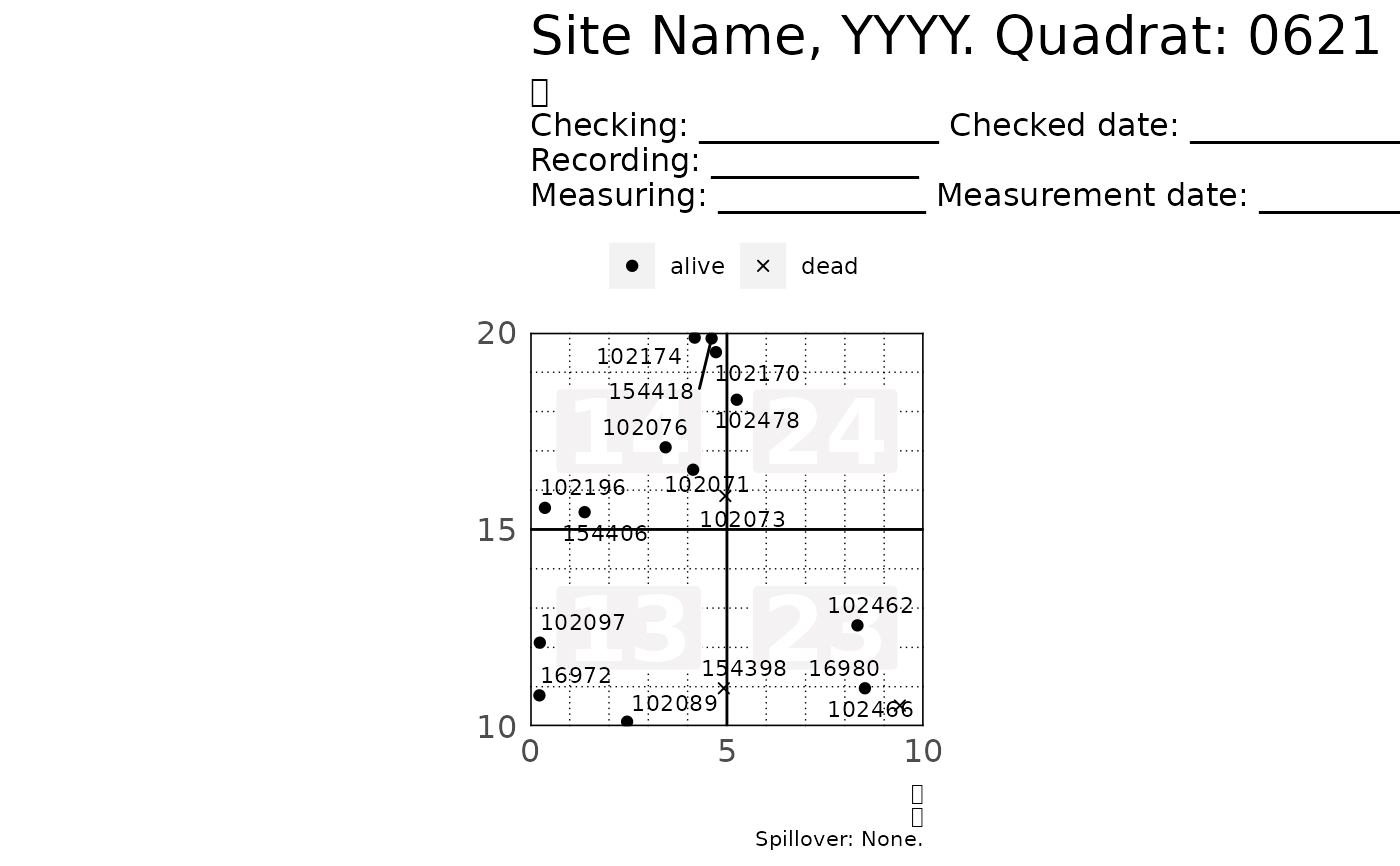
p <- plot_tag_status_by_subquadrat(small_vft)
# Showing only two sub-quadtrats
p[1:2]
#> $`621_1`
#> Warning: Use of `prep_df$tag` is discouraged. Use `tag` instead.
 #>
#> $`621_2`
#> Warning: Use of `prep_df$tag` is discouraged. Use `tag` instead.
#>
#> $`621_2`
#> Warning: Use of `prep_df$tag` is discouraged. Use `tag` instead.
 #>
# To print all plots into a .pdf file see `?pdf()`
plot_tag_status_by_subquadrat(small_vft)
#> $`621_1`
#> Warning: Use of `prep_df$tag` is discouraged. Use `tag` instead.
#>
# To print all plots into a .pdf file see `?pdf()`
plot_tag_status_by_subquadrat(small_vft)
#> $`621_1`
#> Warning: Use of `prep_df$tag` is discouraged. Use `tag` instead.
 #>
#> $`621_2`
#> Warning: Use of `prep_df$tag` is discouraged. Use `tag` instead.
#>
#> $`621_2`
#> Warning: Use of `prep_df$tag` is discouraged. Use `tag` instead.
 #>
#> $`621_3`
#> Warning: Use of `prep_df$tag` is discouraged. Use `tag` instead.
#>
#> $`621_3`
#> Warning: Use of `prep_df$tag` is discouraged. Use `tag` instead.
 #>
#> $`621_4`
#> Warning: Use of `prep_df$tag` is discouraged. Use `tag` instead.
#>
#> $`621_4`
#> Warning: Use of `prep_df$tag` is discouraged. Use `tag` instead.
 #>
# Be careful if filtering by DBH: You may unintentionally remove dead trees.
# * If you filter by `DBH`, you loose the dead trees becaue their `DBH = NA`
# * You should explicietly inlcude missing DBH values with `is.na(DBH)`
include_missing_dbh <- subset(small_vft, DBH > 20 | is.na(DBH))
p <- plot_tag_status_by_subquadrat(include_missing_dbh)
# Showing only the first plot to keep the output short
p[[1]]
#> Warning: Use of `prep_df$tag` is discouraged. Use `tag` instead.
#>
# Be careful if filtering by DBH: You may unintentionally remove dead trees.
# * If you filter by `DBH`, you loose the dead trees becaue their `DBH = NA`
# * You should explicietly inlcude missing DBH values with `is.na(DBH)`
include_missing_dbh <- subset(small_vft, DBH > 20 | is.na(DBH))
p <- plot_tag_status_by_subquadrat(include_missing_dbh)
# Showing only the first plot to keep the output short
p[[1]]
#> Warning: Use of `prep_df$tag` is discouraged. Use `tag` instead.
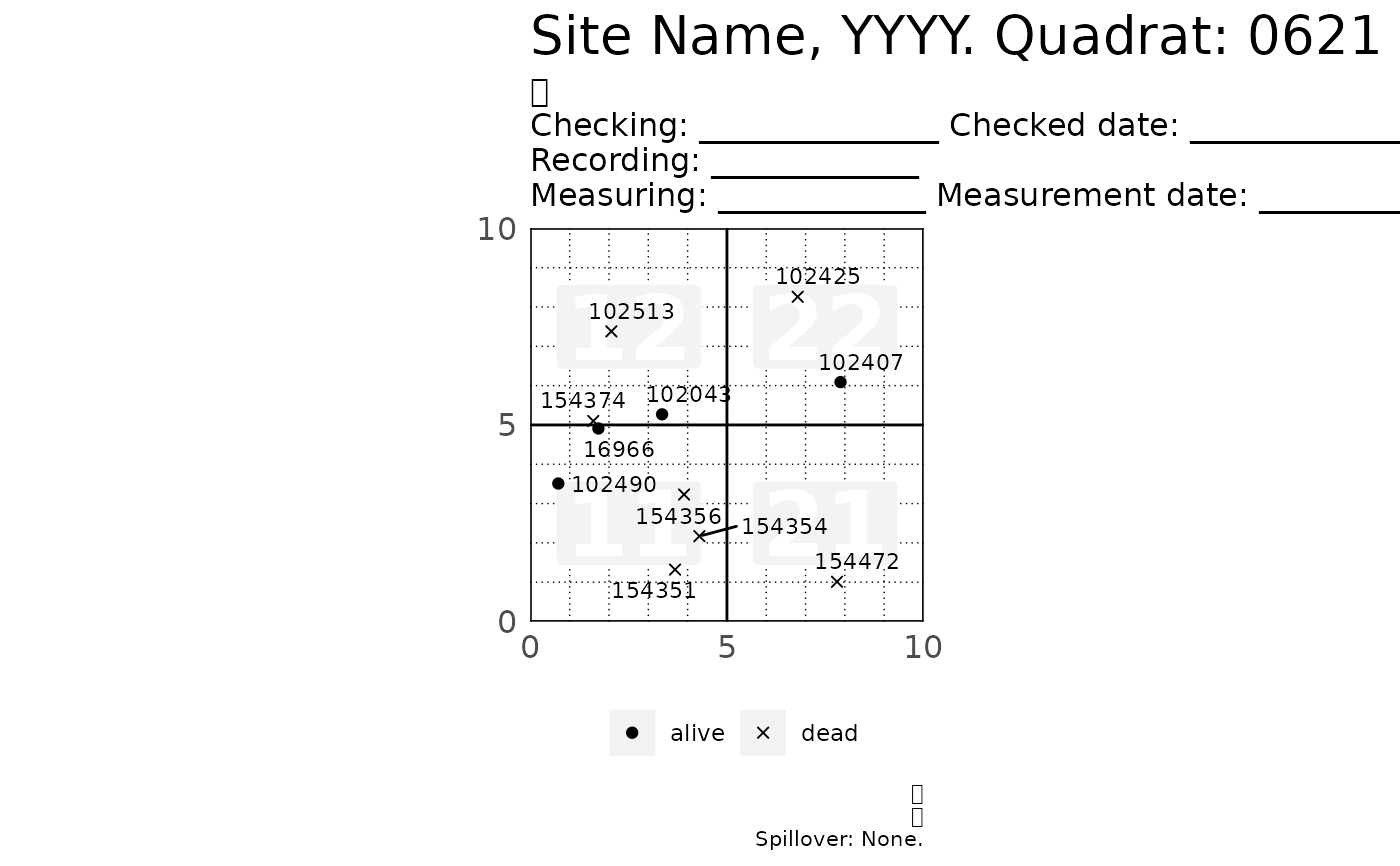
 # Customizing the maps ----------------------------------------------------
# Common tweaks
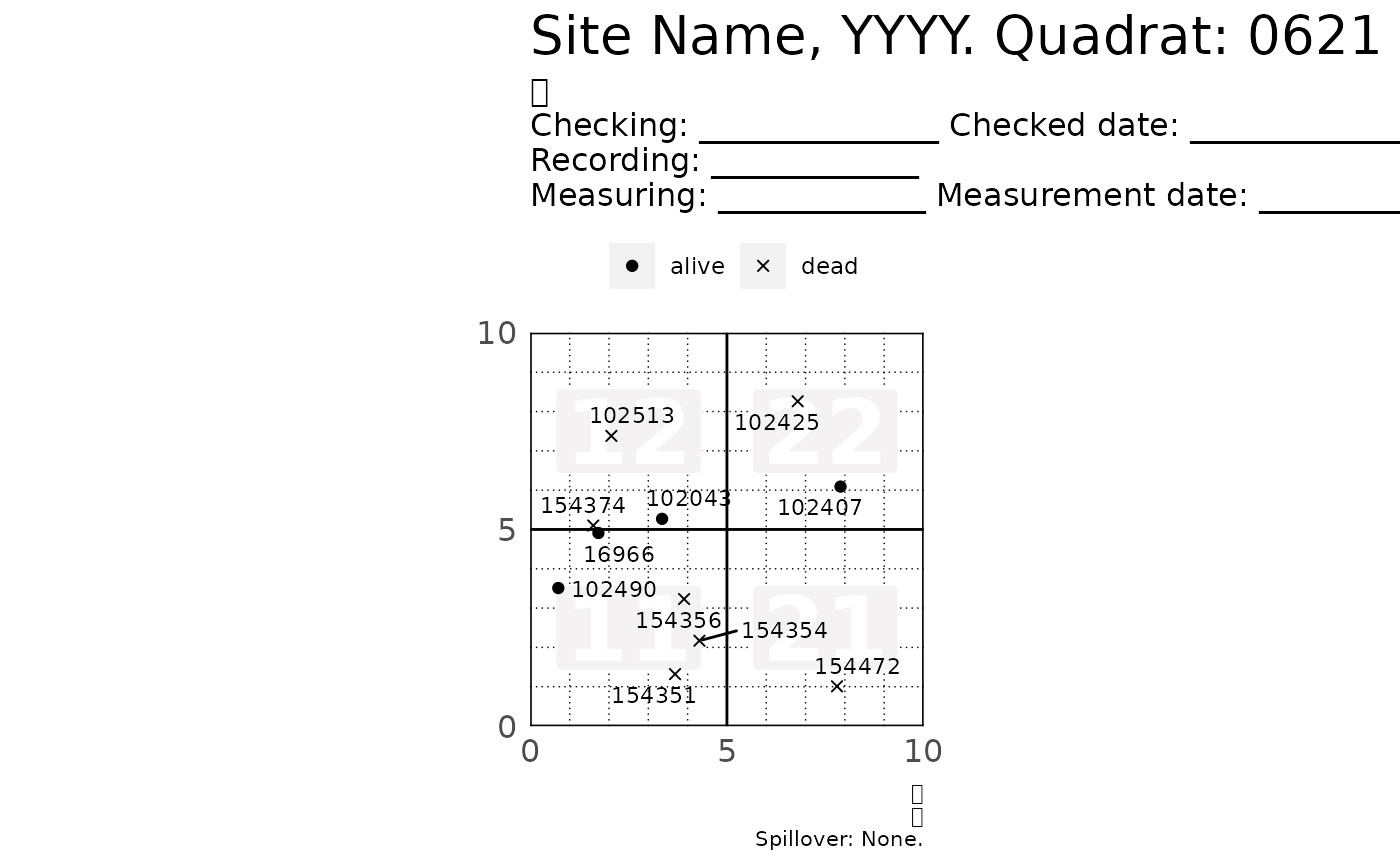
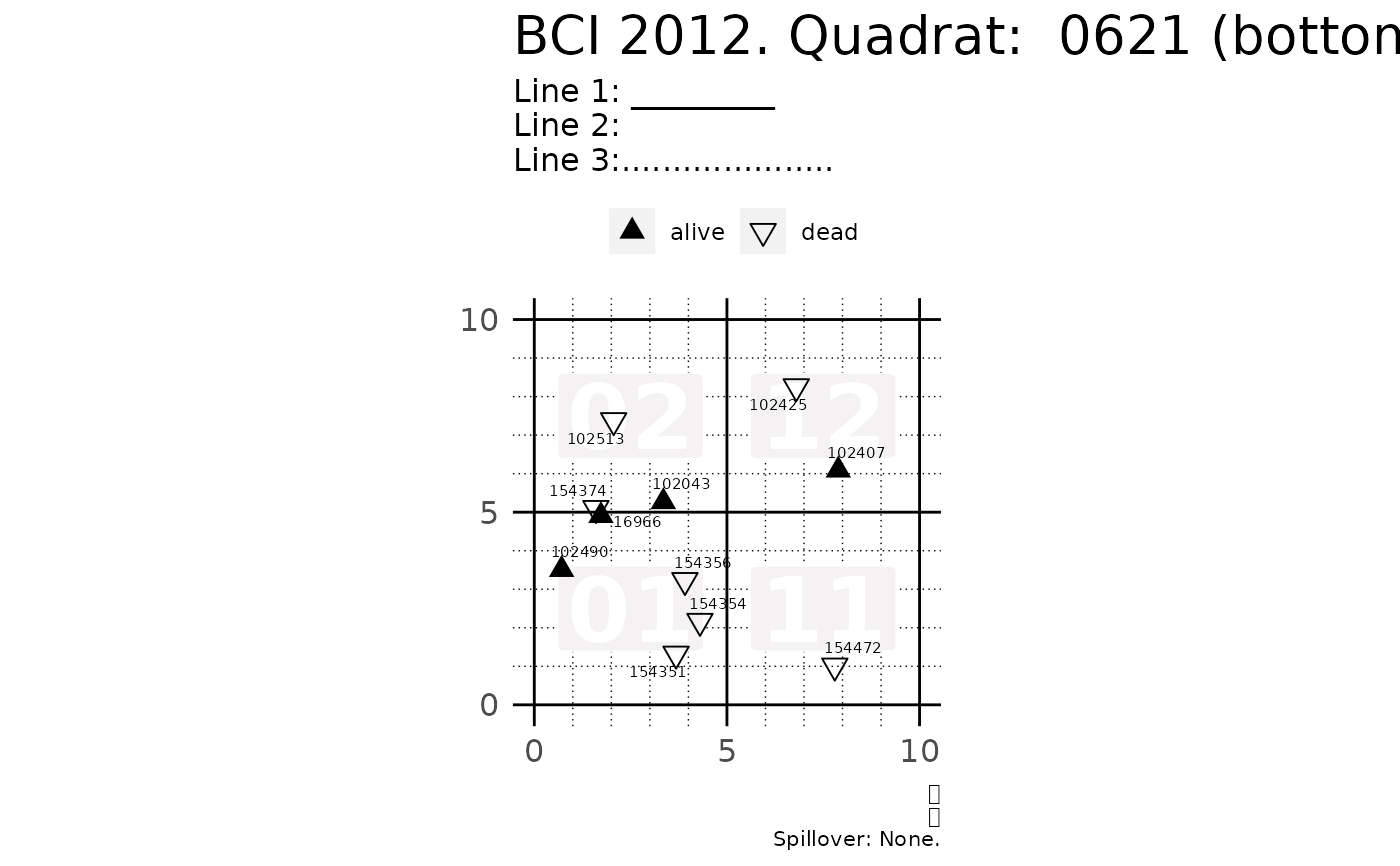
p <- plot_tag_status_by_subquadrat(
small_vft,
title_quad = "BCI 2012. Quadrat: ",
bl = "bottom-left", br = "bottom-right", tr = "top-right", tl = "top-left",
header = "Line 1: _________\nLine 2:\nLine 3:.....................",
subquad_offset = -1,
point_size = 3, point_shape = c(17, 6),
tag_size = 2,
move_edge = 0.5
)
p[[1]]
#> Warning: Use of `prep_df$tag` is discouraged. Use `tag` instead.
# Customizing the maps ----------------------------------------------------
# Common tweaks
p <- plot_tag_status_by_subquadrat(
small_vft,
title_quad = "BCI 2012. Quadrat: ",
bl = "bottom-left", br = "bottom-right", tr = "top-right", tl = "top-left",
header = "Line 1: _________\nLine 2:\nLine 3:.....................",
subquad_offset = -1,
point_size = 3, point_shape = c(17, 6),
tag_size = 2,
move_edge = 0.5
)
p[[1]]
#> Warning: Use of `prep_df$tag` is discouraged. Use `tag` instead.
 # Skip R CMD check for speed
# \donttest{
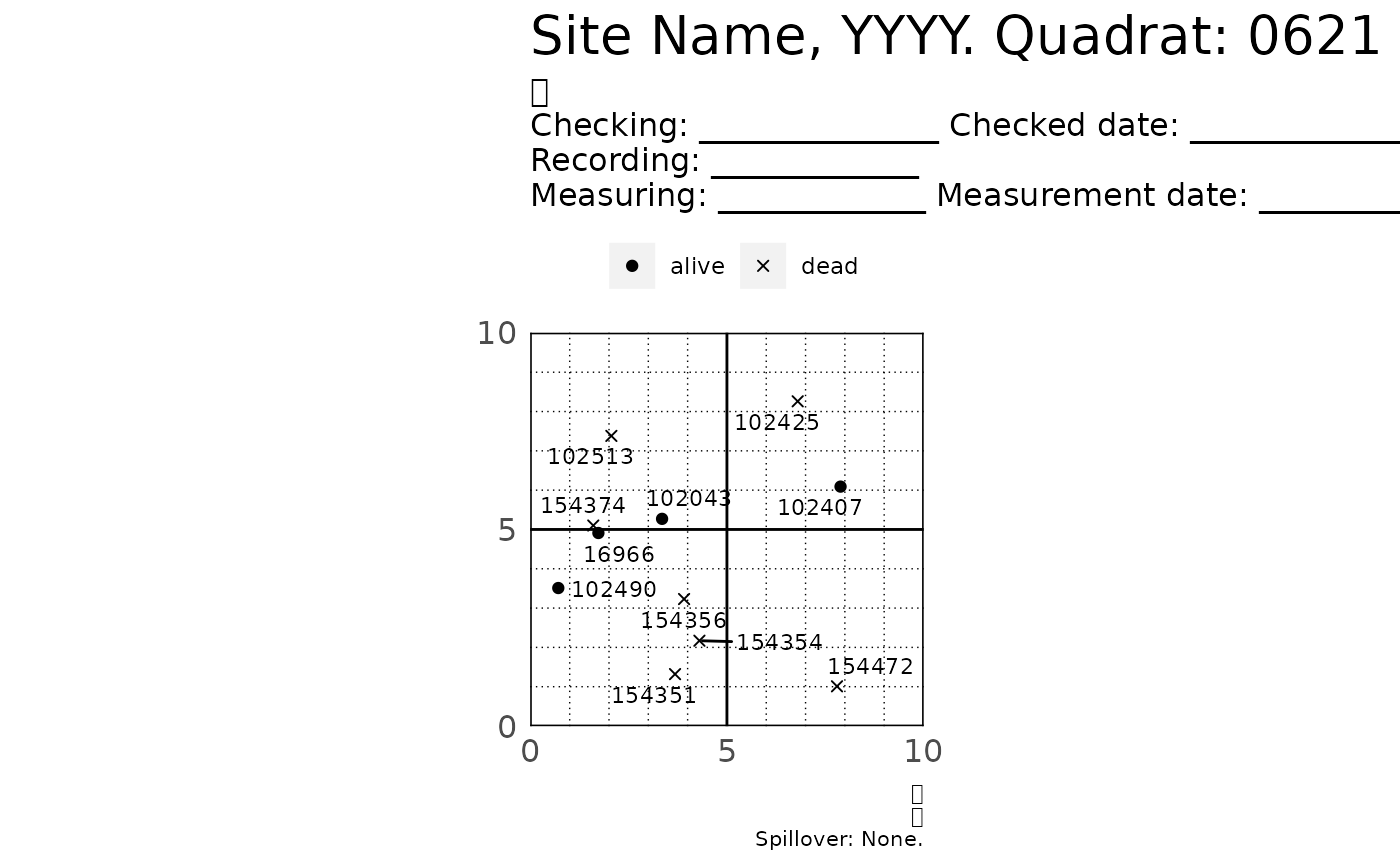
p <- plot_tag_status_by_subquadrat(
small_vft,
show_page = FALSE,
show_subquad = FALSE
)
p[[1]]
#> Warning: Use of `prep_df$tag` is discouraged. Use `tag` instead.
# Skip R CMD check for speed
# \donttest{
p <- plot_tag_status_by_subquadrat(
small_vft,
show_page = FALSE,
show_subquad = FALSE
)
p[[1]]
#> Warning: Use of `prep_df$tag` is discouraged. Use `tag` instead.
 # Themes
library(ggplot2)
p <- plot_tag_status_by_subquadrat(small_vft, theme = theme_gray())
p[[1]]
#> Warning: Use of `prep_df$tag` is discouraged. Use `tag` instead.
# Themes
library(ggplot2)
p <- plot_tag_status_by_subquadrat(small_vft, theme = theme_gray())
p[[1]]
#> Warning: Use of `prep_df$tag` is discouraged. Use `tag` instead.
 # Tweaking the default theme of plot_tag_status_by_subquadrat()
# For many more options see ?ggplot2::theme
small_tweak <- theme_tag_status(legend.position = "bottom")
p <- plot_tag_status_by_subquadrat(small_vft, theme = small_tweak)
p[[1]]
#> Warning: Use of `prep_df$tag` is discouraged. Use `tag` instead.
# Tweaking the default theme of plot_tag_status_by_subquadrat()
# For many more options see ?ggplot2::theme
small_tweak <- theme_tag_status(legend.position = "bottom")
p <- plot_tag_status_by_subquadrat(small_vft, theme = small_tweak)
p[[1]]
#> Warning: Use of `prep_df$tag` is discouraged. Use `tag` instead.
 # }
# }