List plots of species distribution and topography (good for pdf output).
Source:R/autoplot_by_species.R
autoplot_by_species.sp_elev.RdThese functions extend autoplot.sp() and autoplot.elev() and return not a
single plot but a list of plots. They are particularly useful if you want to
print a .pdf file with one plot per page. They automatically plot the
variables sp and elev of a ForestGEO-like dataset of class 'sp' or
'sp_elev'.
Create a 'sp'
objectwith:
object <- sp(DATA-WITH-VARIABLE-sp)Create a 'sp_elev'
objectwith:
object <- sp_elev(DATA-WITH-VARIABLE-sp, DATA-WITH-VARIABLE-elev)See sections Usage and Examples.
# S3 method for sp_elev
autoplot_by_species(
  object,
  species = "all",
  fill = "black",
  shape = 21,
  point_size = 3,
  contour_size = 0.5,
  low = "blue",
  high = "red",
  hide_color_legend = FALSE,
  bins = NULL,
  add_elevation_labels = TRUE,
  label_size = 3,
  label_color = "grey",
  xyjust = 1,
  fontface = "italic",
  xlim = NULL,
  ylim = NULL,
  custom_theme = NULL,
  ...
)

# S3 method for sp
autoplot_by_species(
  object,
  species = "all",
  fill = "black",
  shape = 21,
  point_size = 3,
  hide_color_legend = FALSE,
  xlim = NULL,
  ylim = NULL,
  custom_theme = NULL,
  ...
)
Arguments
- object
- species
A character vector giving values in the column
sp. The output will be a list with as many plots as elements in this vector. The string "all" (default) plots all unique values ofsp.- fill
Character; either a color or "sp", which maps each species to a different color.
- shape
A number giving point shape (as in
graphics::points()). Passed toggplot2::geom_point().- point_size
A number giving point size. Passed to
ggplot2::geom_point().- contour_size
A number giving the size of the contour of elevation lines. Passed to
ggplot2::stat_contour()(seeggplot2::geom_contour()).- low, high
A string giving a color of the elevation lines representing low and high elevation.
- hide_color_legend
Logical;
TRUEhides the color legend.- bins
A number giving the number of elevation lines to plot.
- add_elevation_labels
Logical;
FALSEhides elevation labels.- label_size, label_color, fontface
A number (
label_size) or character string (label_colorandfontface) giving the size, colour and fontface of the text labels for the elevation lines.- xyjust
A number to adjust the position of the text labels of the elevation lines.
- xlim, ylim
A vector of length 2, for example
c(0, 500), giving the minimum and maximum limits of the vertical and horizontal coordinates.- custom_theme
A valid
ggplot2::theme().NULLuses the default themetheme_default().- ...
Not used (included for compatibility across methods).
Value
A list of objects of class "ggplot".
Details
autoplot_by_species(sp_elev(DATA-WITH-VARIABLE-sp) (without elevation data)
is equivalent to autoplot_by_species(sp(DATA-WITH-VARIABLE-sp)).
fgeo.plot wraps some functions from the ggplot2 package. For more control you can use ggplot2 directly.
See also
Other plot functions:
autoplot.fgeo_habitat(),
autoplot.sp_elev(),
elev(),
plot_dbh_bubbles_by_quadrat(),
plot_tag_status_by_subquadrat(),
sp_elev(),
sp()
Other functions to plot elevation:
autoplot.sp_elev(),
elev(),
sp_elev()
Other functions to plot species:
autoplot.sp_elev(),
sp_elev(),
sp()
Examples
assert_is_installed("fgeo.x")
# Species ---------------------------------------------------------------
# Small dataset with a few species for quick examples
census <- fgeo.x::tree6_3species
# Showing only two species for speed
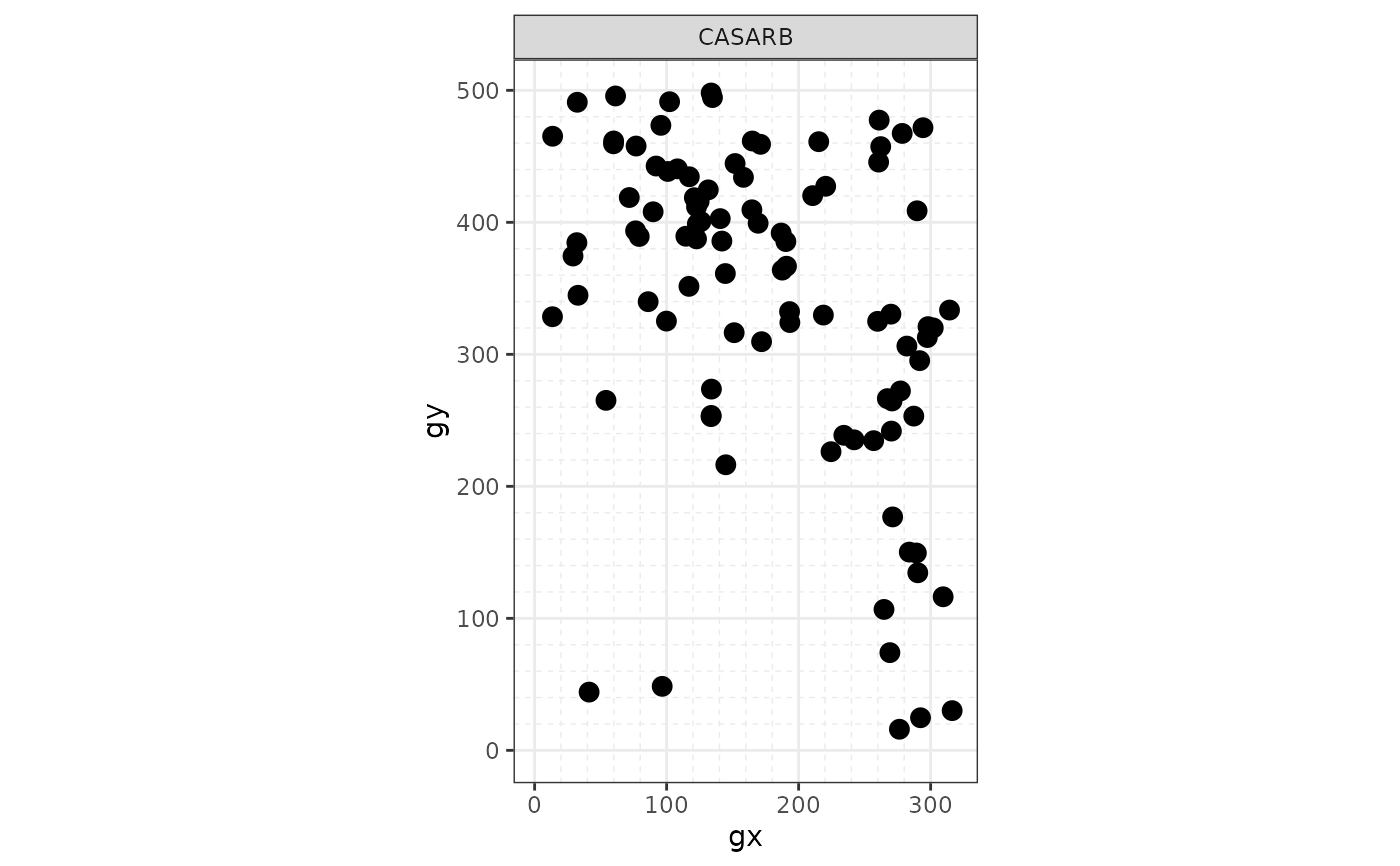
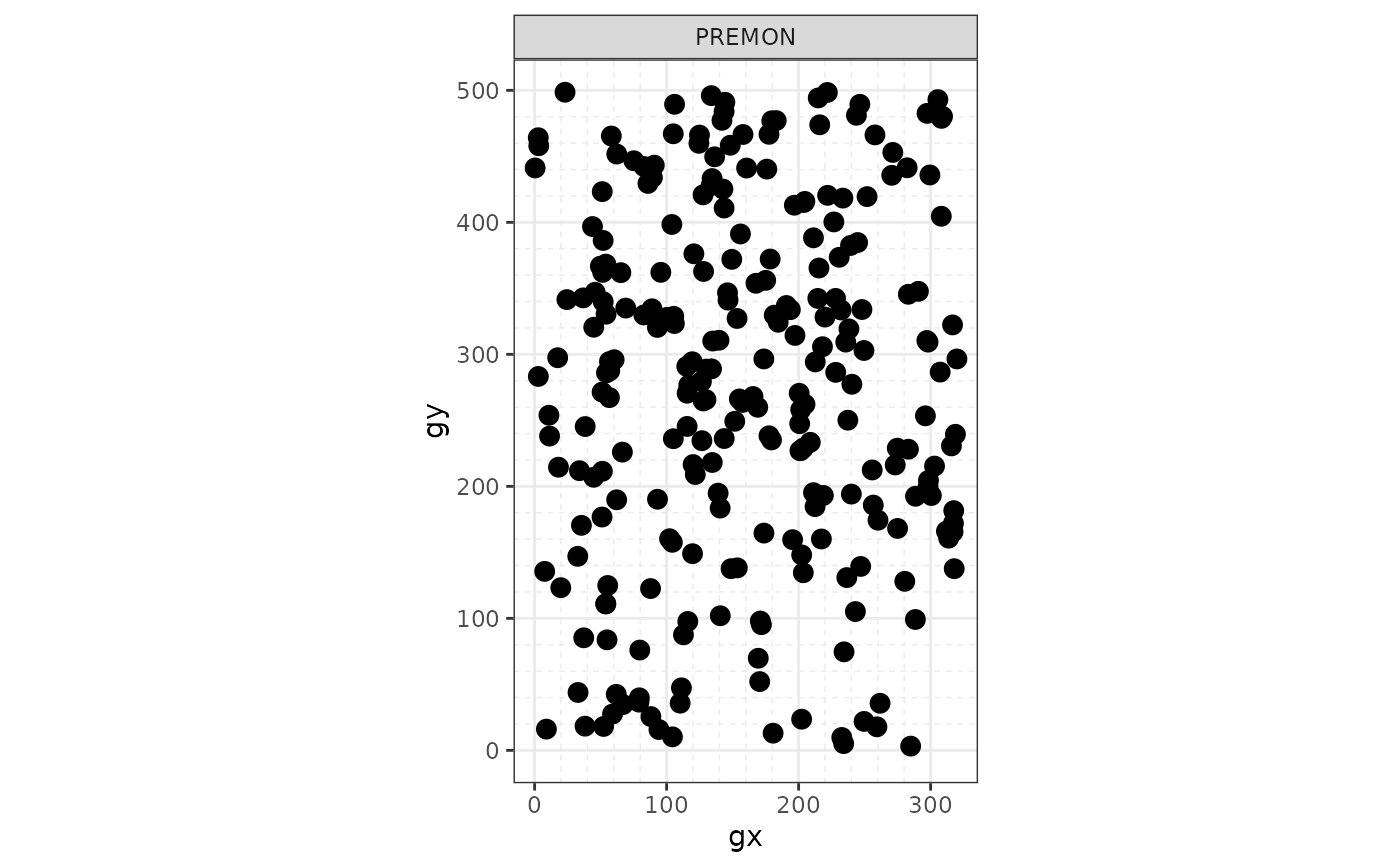
autoplot_by_species(sp(census))[1:2]
#> $CASARB
 #>
#> $PREMON
#>
#> $PREMON
 #>
# To print all plots in a .pdf see `?pdf()`
autoplot_by_species(sp(census))
#> $CASARB
#>
# To print all plots in a .pdf see `?pdf()`
autoplot_by_species(sp(census))
#> $CASARB
 #>
#> $PREMON
#>
#> $PREMON
 #>
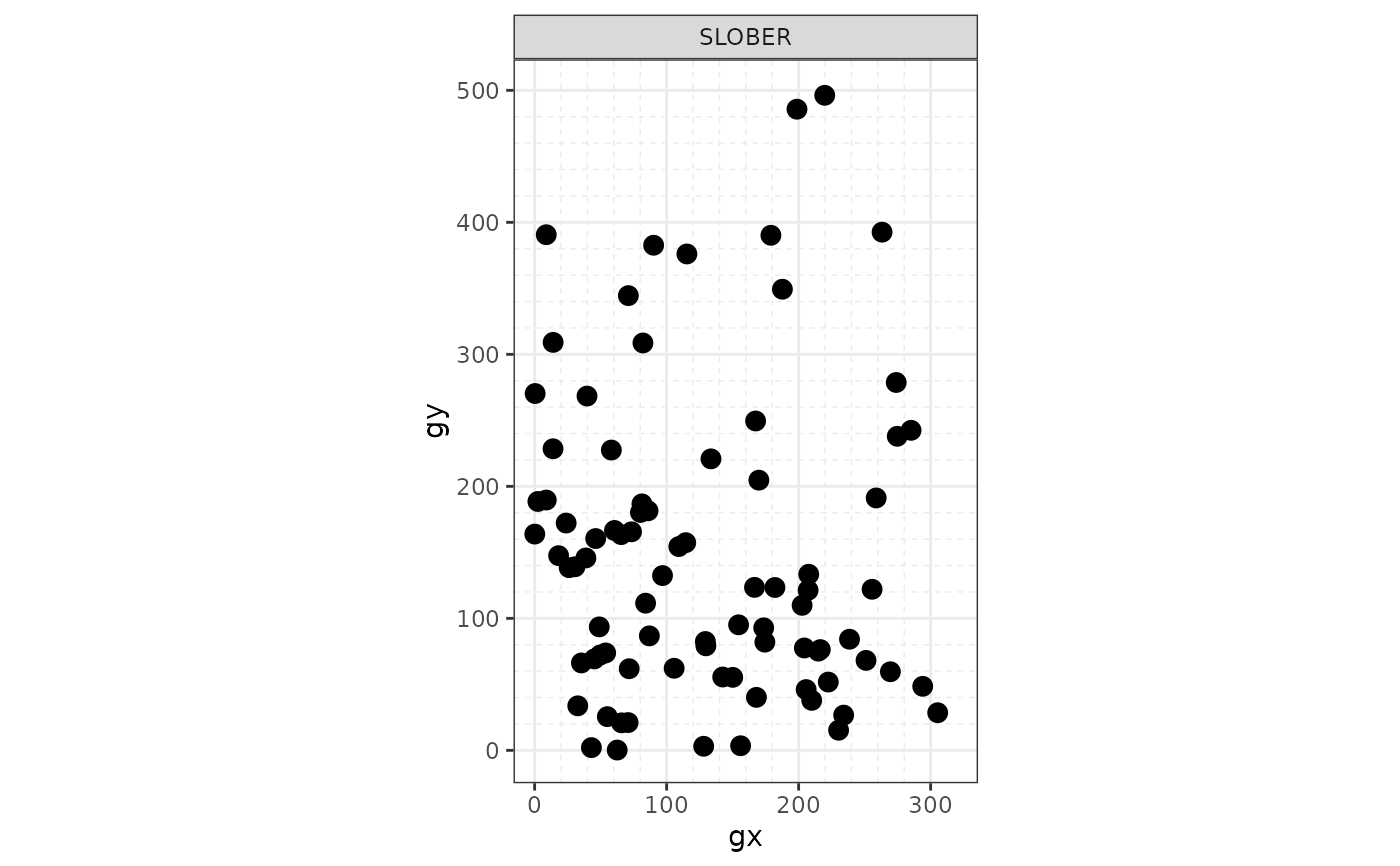
#> $SLOBER
#>
#> $SLOBER
 #>
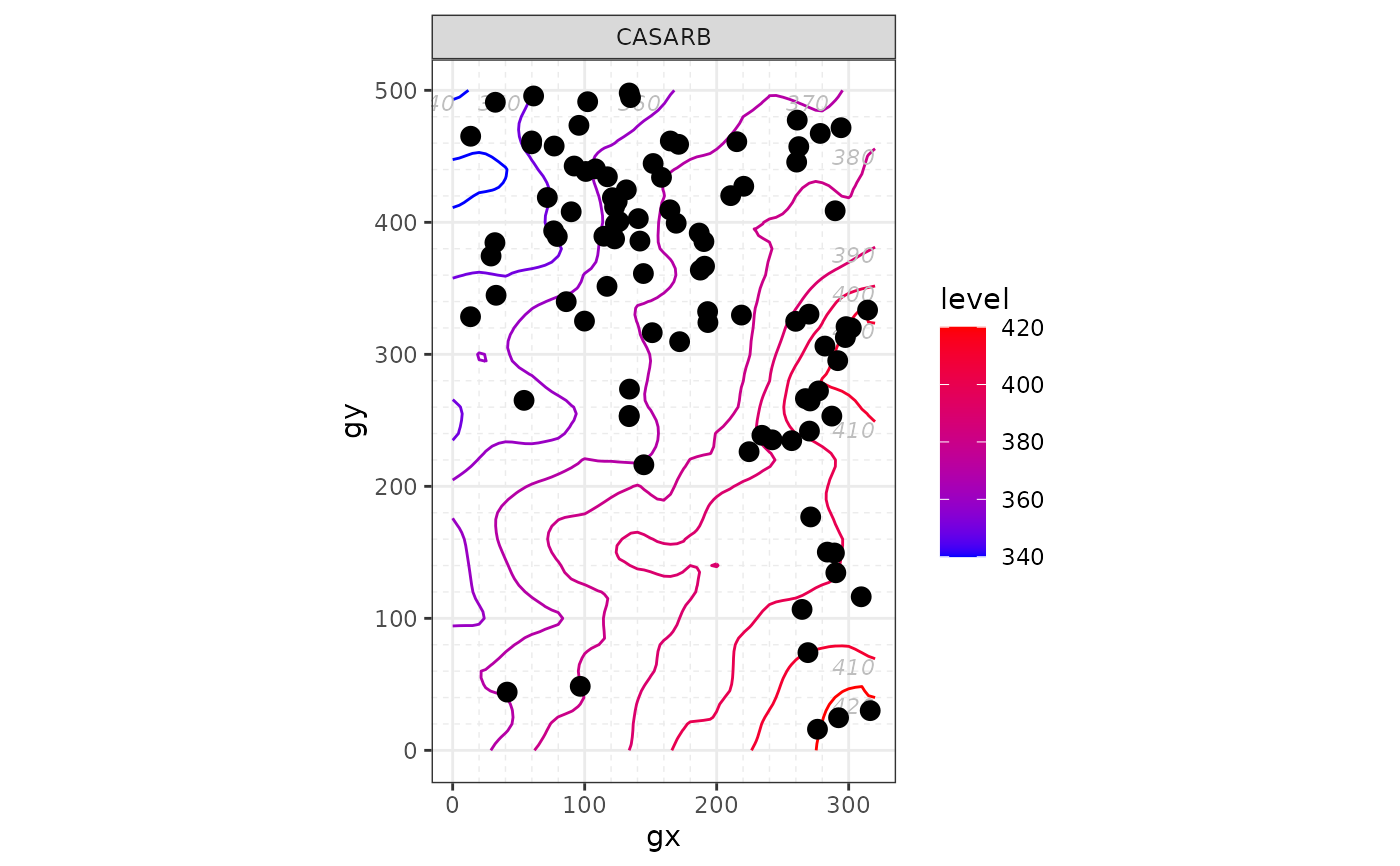
# Species and elevation (optional) ---------------------------------------
# Species and elevation
elevation <- fgeo.x::elevation
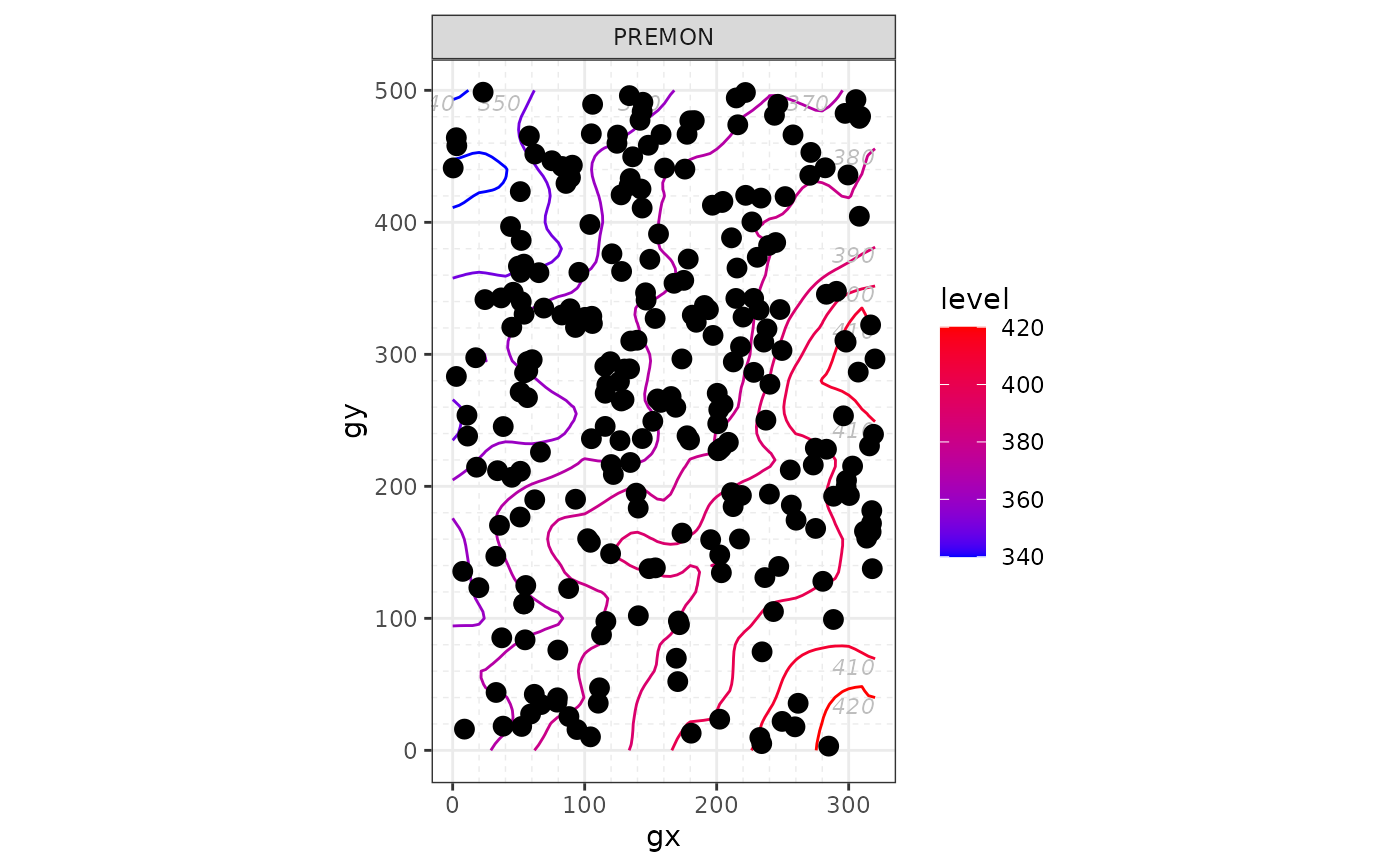
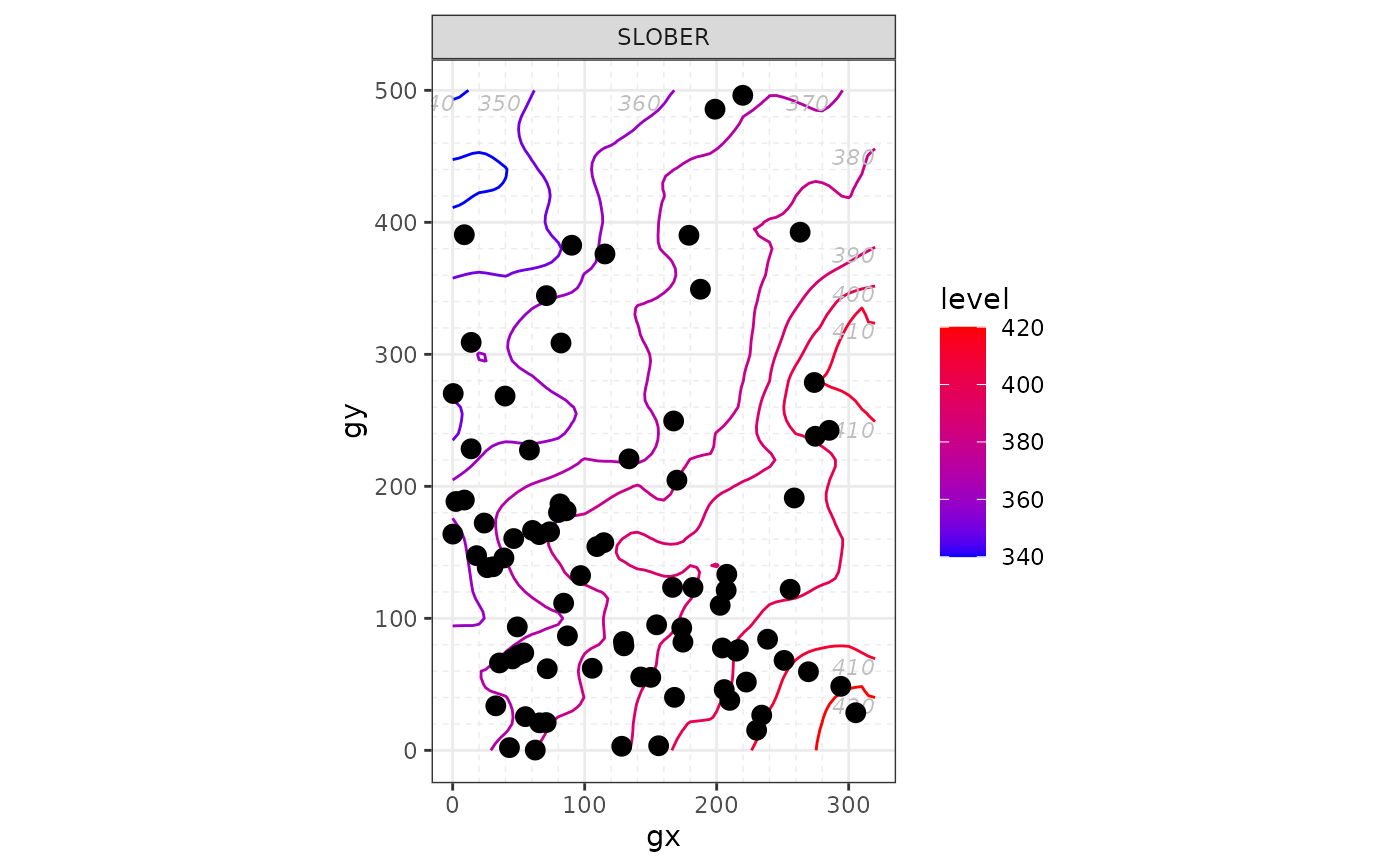
autoplot_by_species(sp_elev(census, elevation))
#> $CASARB
#>
# Species and elevation (optional) ---------------------------------------
# Species and elevation
elevation <- fgeo.x::elevation
autoplot_by_species(sp_elev(census, elevation))
#> $CASARB
 #>
#> $PREMON
#>
#> $PREMON
 #>
#> $SLOBER
#>
#> $SLOBER
 #>
#>